Short answer: The best dashboard UI designs - Stripe, Linear, Notion, Figma, HubSpot, (everything Jira does), and others - all share one principle: they turn complexity into clarity. They surface the few numbers that drive decisions, hide the rest until asked, and use hierarchy, whitespace and restraint so users feel in control instead of buried in data.
Best Practice: Design the Dashboard Last, Not First
One of the biggest mistakes teams make is designing the dashboard before the product itself.
The best dashboard UI designs are created after the core functionality has been planned, designed, and validated. A dashboard isn't the product - it's a summary of the product. Its job is to give users a quick understanding of what's happening across every key feature, helping them decide where to take action next.
Top 10 Best Dashboard UI Designs SaaS Founders Secretly Copy
1. Amuse: Turning Entertainment Chaos Into Clickable Calm
_11zon_3i6y1bgmei7m7aj.webp)
The entertainment industry runs on last-minute changes, impossible schedules, and people who swear they "already sent the contract." Designing a dashboard for that mess is exactly why Amuse lands first on our list. It is an entertainment booking app that connects businesses with their customers, making it easier to handle events, manage gigs, and cut the endless back-and-forth.
The Amuse dashboard was built to simplify how entertainment businesses manage bookings and connect with travelers. It brings listings, reservations, customer inquiries, availability, payments, and business performance into one intuitive workspace.
2. Notion: Very Flexible Dashboard
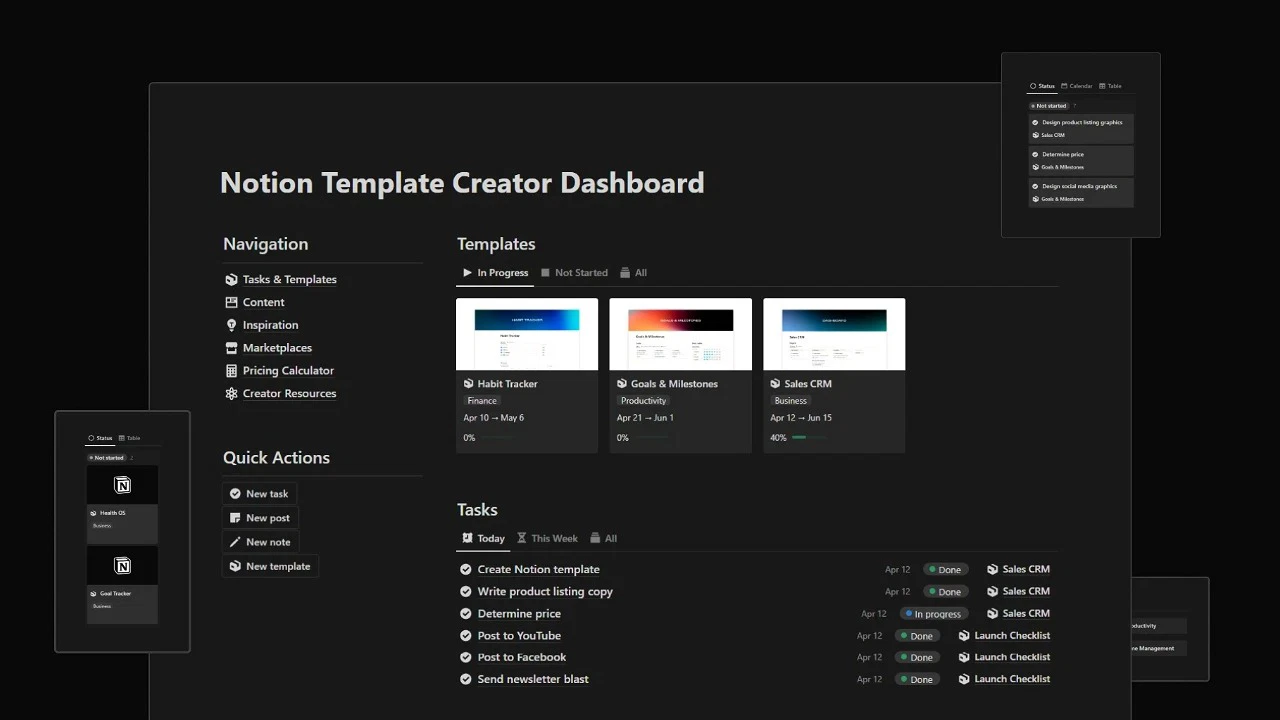
Notion is proof that when you give users infinite flexibility, they will build either a productivity empire or a digital landfill. It lets teams create docs, wikis, and project boards that are endlessly customizable, and its dashboard is the control tower for all of it. The real genius is that users design their own dashboards. Ironically, Notion does not hand you "the dashboard," it hands you the tools to craft one, and that very flexibility is why it keeps showing up among the best dashboard UI designs. The catch, of course, is that the toolbox does not stop you from building something that looks like abstract art.
Looking for Great Dashboard Design? Take a look inside our case studies
3. Search AI: Clean & Smart Data Organization
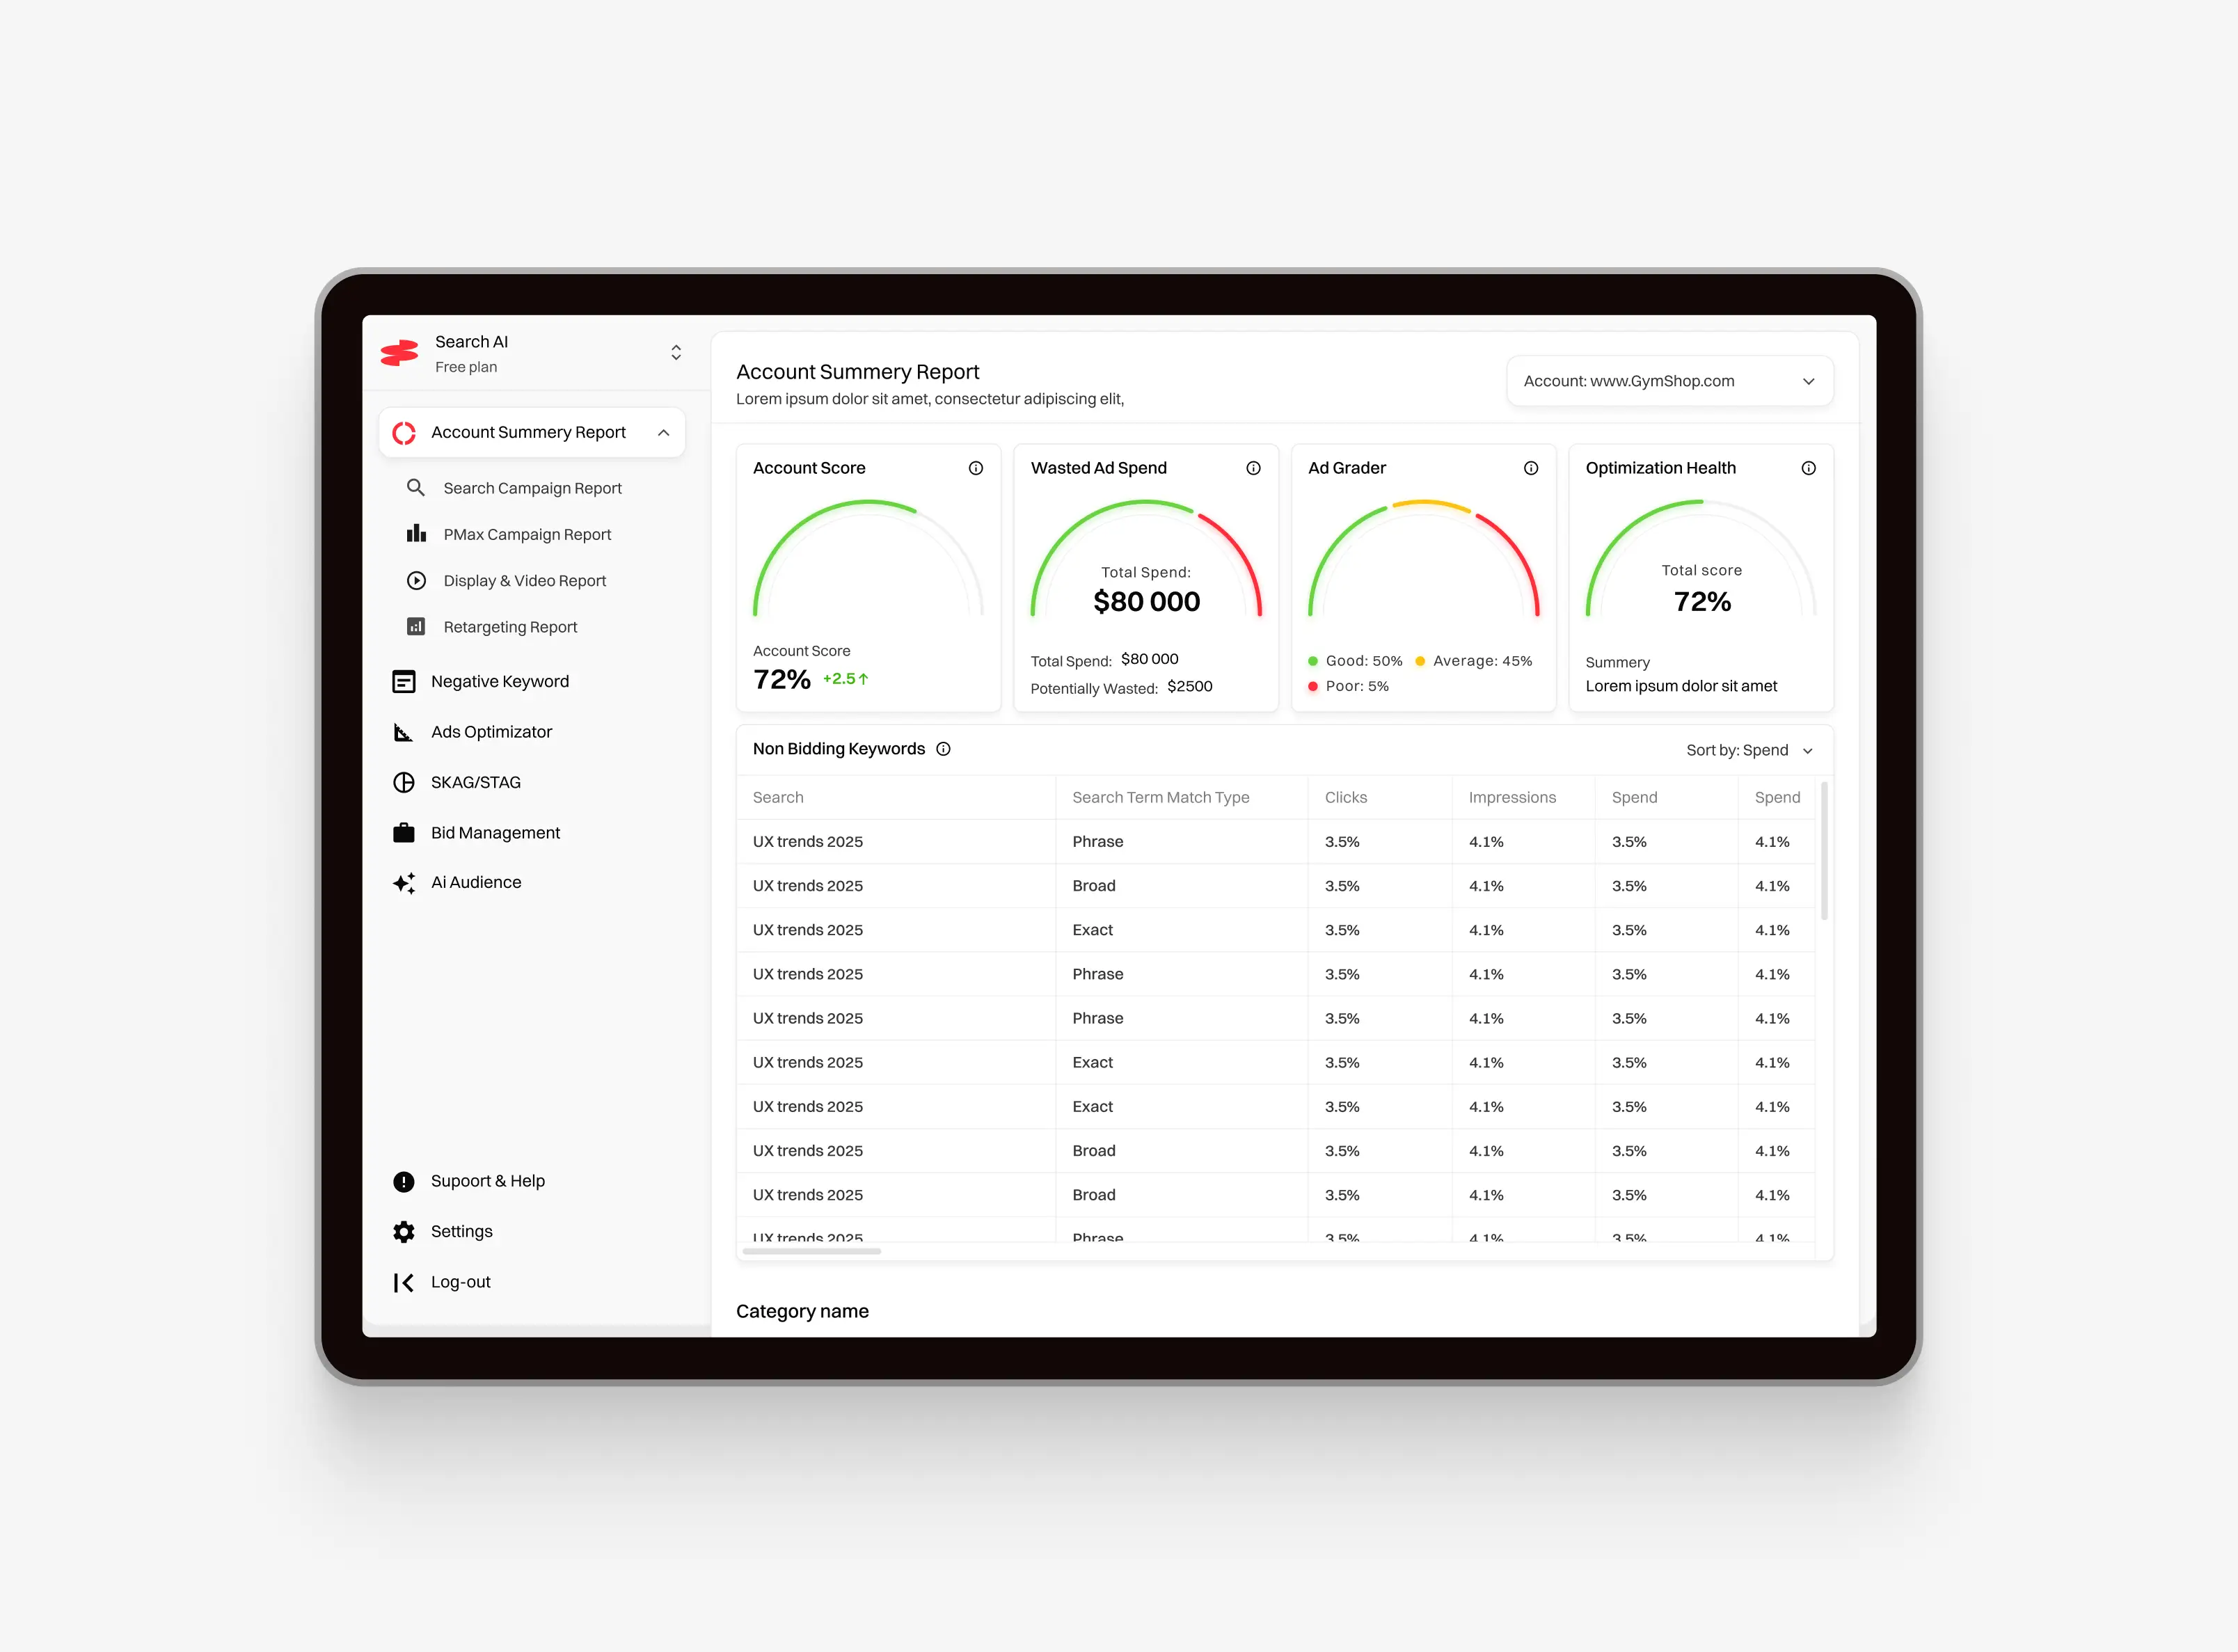
Marketing intelligence dashboard designed to help teams understand how their brand performs across search engines and AI-powered search platforms. Rather than presenting raw analytics, it transforms large datasets into clear, actionable insights that marketers can use to improve visibility and content strategy.
Compared to tools like SEMrush or Matomo, Search AI prioritizes usability and clarity over feature overload. Rather than packing every possible metric into the interface, it presents the information marketers actually need in a clean, intuitive dashboard that makes data easier to explore and act on.
4. Airtable: The Spreadsheet That Went to Design School
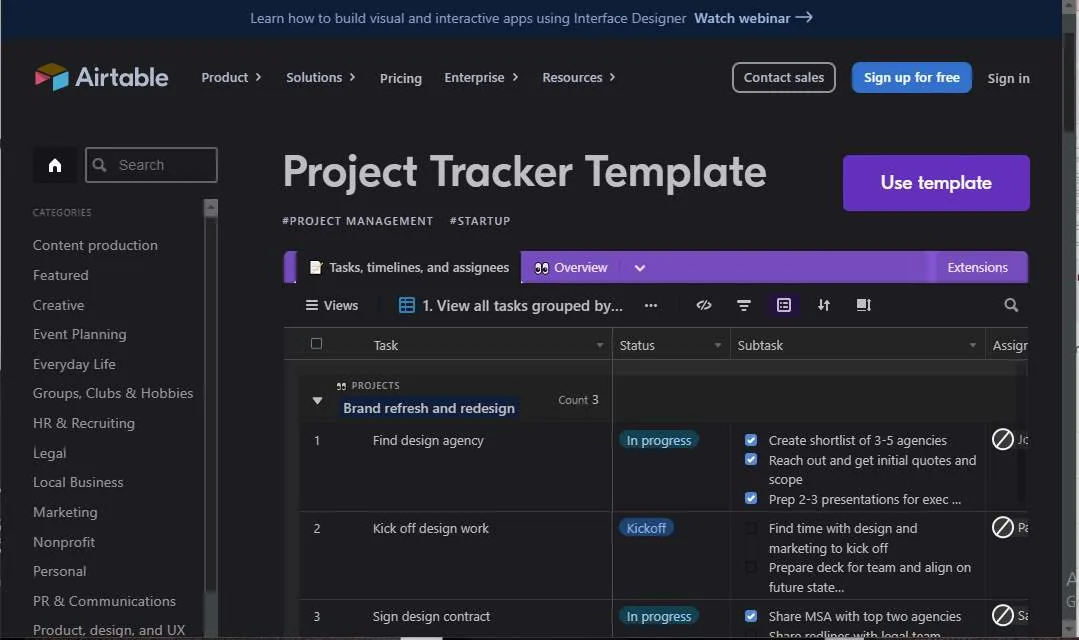
Spreadsheets are humanity's least glamorous invention, yet Airtable turned them into something people actually brag about. It is a hybrid between a spreadsheet and a database, essentially a spreadsheet with a better haircut and a social life. Its dashboard is deceptively simple, letting you switch between grid, kanban, calendar, and gallery views with a single click. The design is not just pretty, it makes complex data human-friendly, proving dashboards do not need neon charts to be useful, just clean layouts and enough customization to make founders feel like geniuses.
5. Jira: The Standard for Agile Project Management
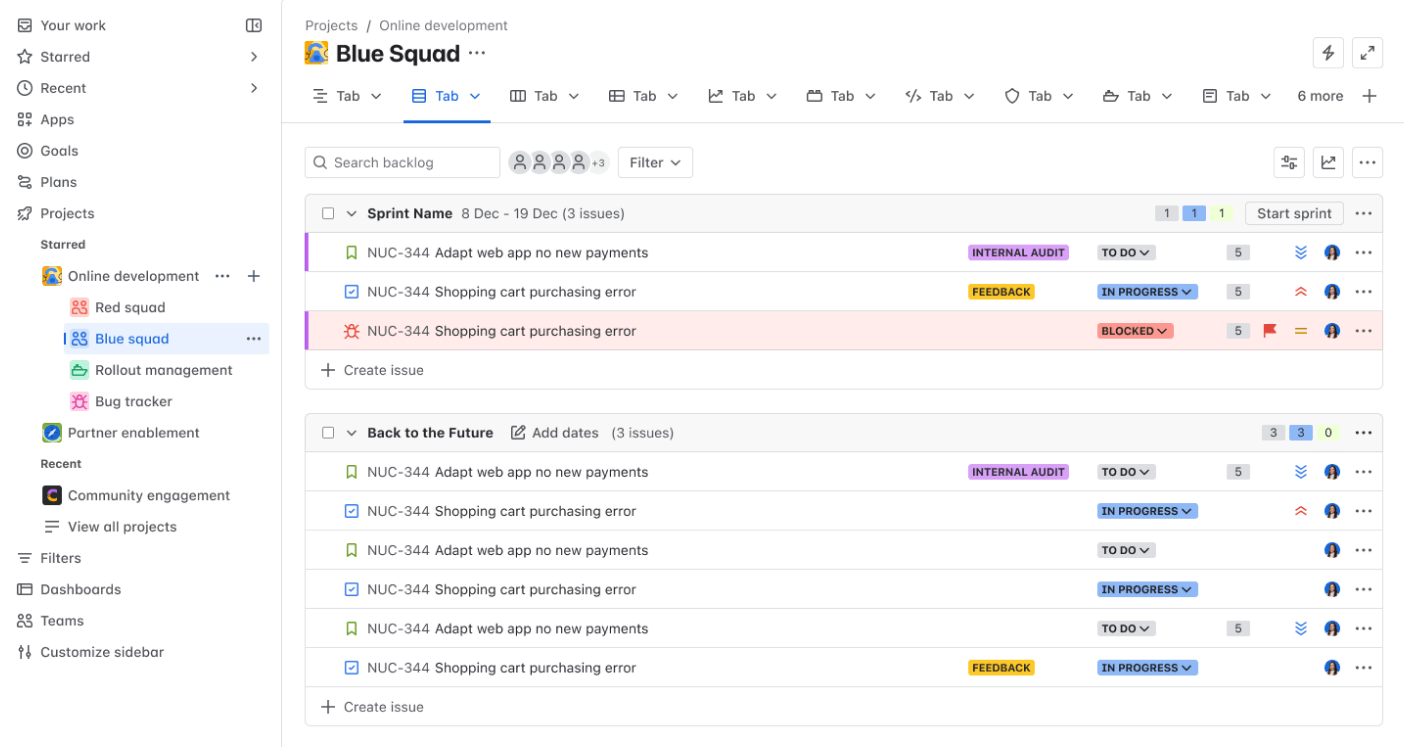
Designed with flexibility in mind, Jira allows organizations to create dashboards tailored to different roles—from developers tracking sprint tasks to executives monitoring delivery timelines and project health.
6. Figma: Designing the Designers' Dashboard
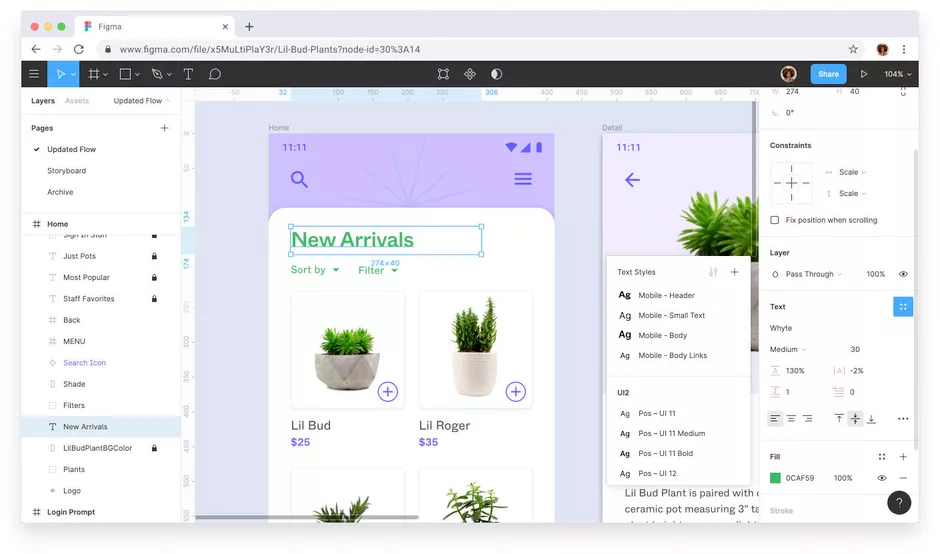
Figma is what happens when a dashboard becomes a cult. Designers live inside it, and for good reason. It is a collaborative design tool that lets teams build, prototype, and comment in real time, and its dashboard balances utility with minimalism. File previews, project folders, and team activity are laid out in a way that makes sense even when you are juggling 20 projects. The dashboard reflects Figma's whole philosophy of transparency and collaboration: everything feels instant, intuitive, and clean, without needing a 50-page manual.
7. Stripe: Where Money Meets Minimalism
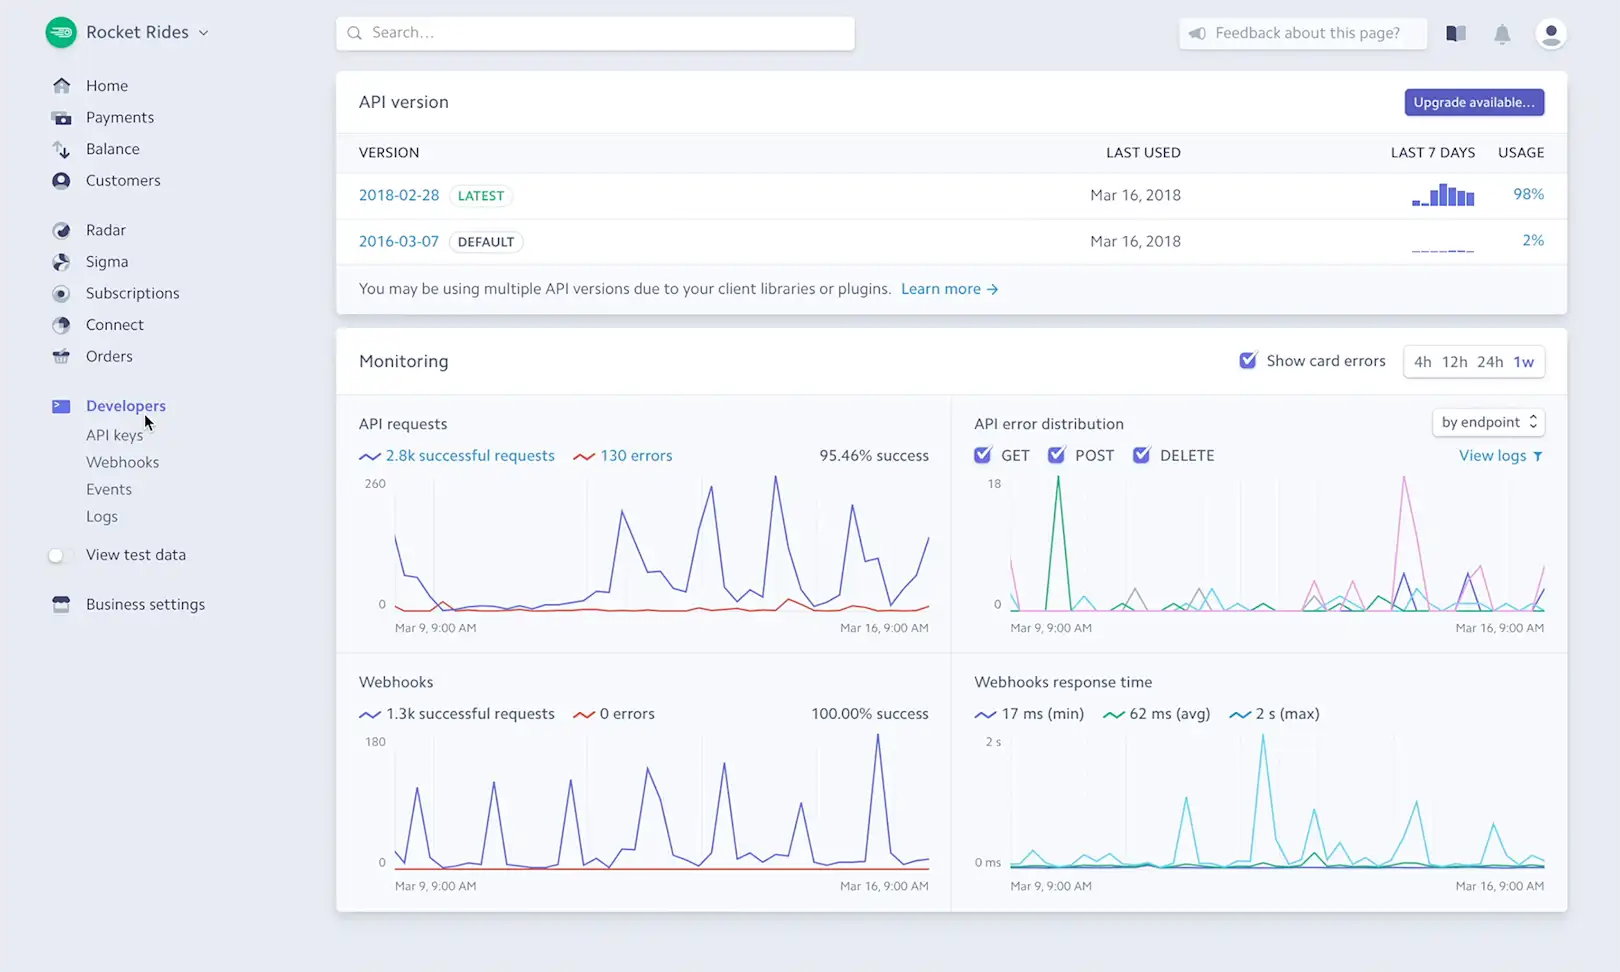
Most finance dashboards look like tax season in visual form. Stripe decided to treat its users like humans instead of auditors. It is a payment processing platform used by startups and enterprises alike, and its dashboard focuses on what matters most, payments, revenue trends, and customer data, without drowning anyone in legalese. Clean typography, accessible color schemes, and intuitive navigation make complex financial flows digestible. Stripe proves financial dashboards do not have to be terrifying; they can be calm, clear, and even pleasant.
8. Linear: Task Management Without the Bloat
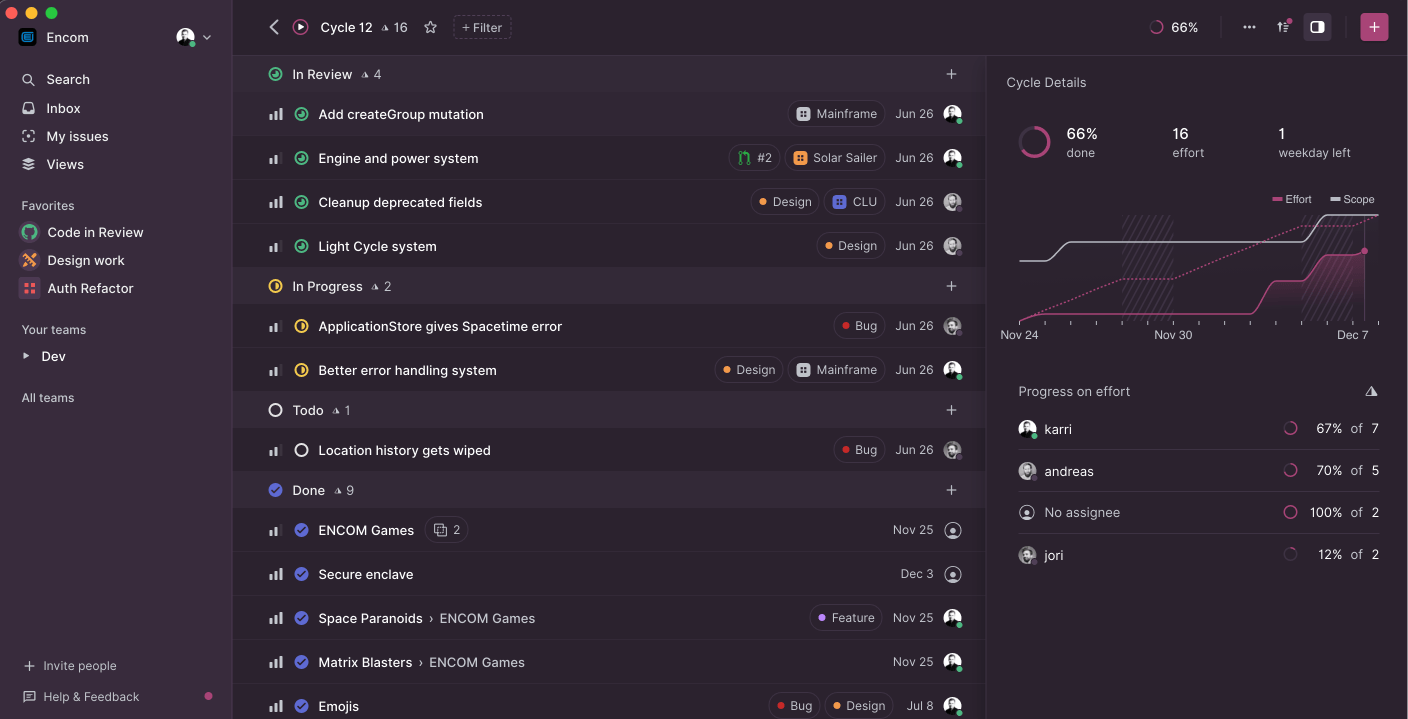
Project management dashboards are notorious for clutter. Linear broke the cycle and became a benchmark for clean design. It is a task and project management tool for fast-moving software teams, and its dashboard is sleek, fast, and minimal, avoiding feature creep to focus on the essentials: issues, timelines, and progress. Linear's design shows real respect for users' time. It is not trying to be everything, it is just trying to be fast, clear, and elegant, and that restraint is exactly why people love it.
9. HubSpot: Deserved 9
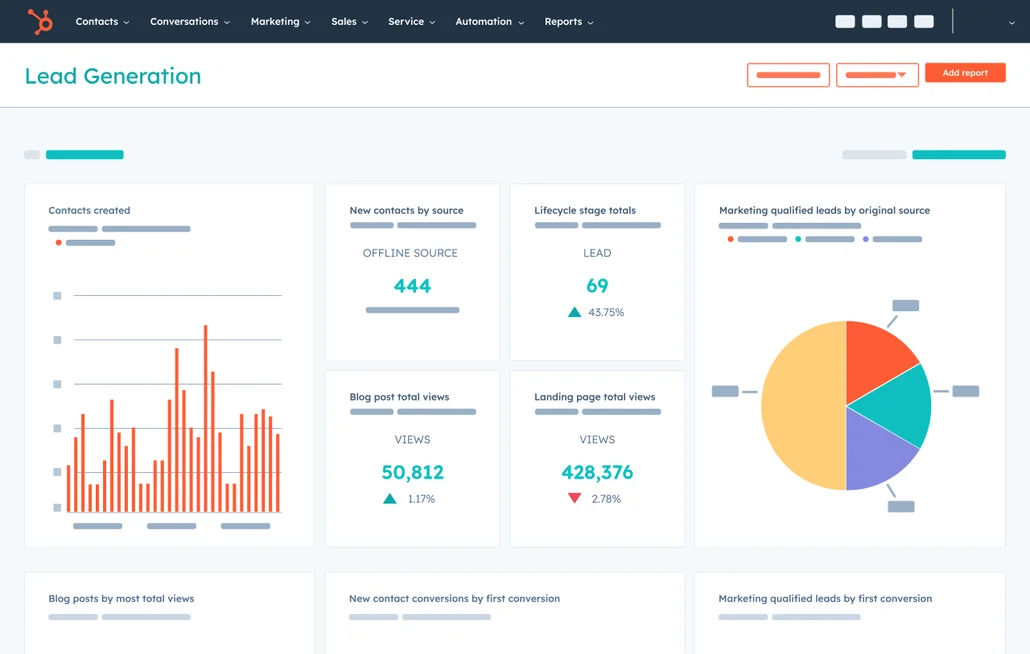
CRM dashboards are usually where optimism goes to die. HubSpot somehow survives. It is a CRM platform that helps businesses manage contacts, marketing campaigns, sales pipelines, and support in one place, and its dashboard balances a mountain of data with genuine visual clarity. KPIs, email campaigns, and lead pipelines appear in digestible cards, graphs, and lists rather than a mission-control wall of numbers. HubSpot respects that users want insight, not chaos, giving a high-level overview without sacrificing detail, a rare feat in the CRM world.
10. Monday.com: Optimized for their goals
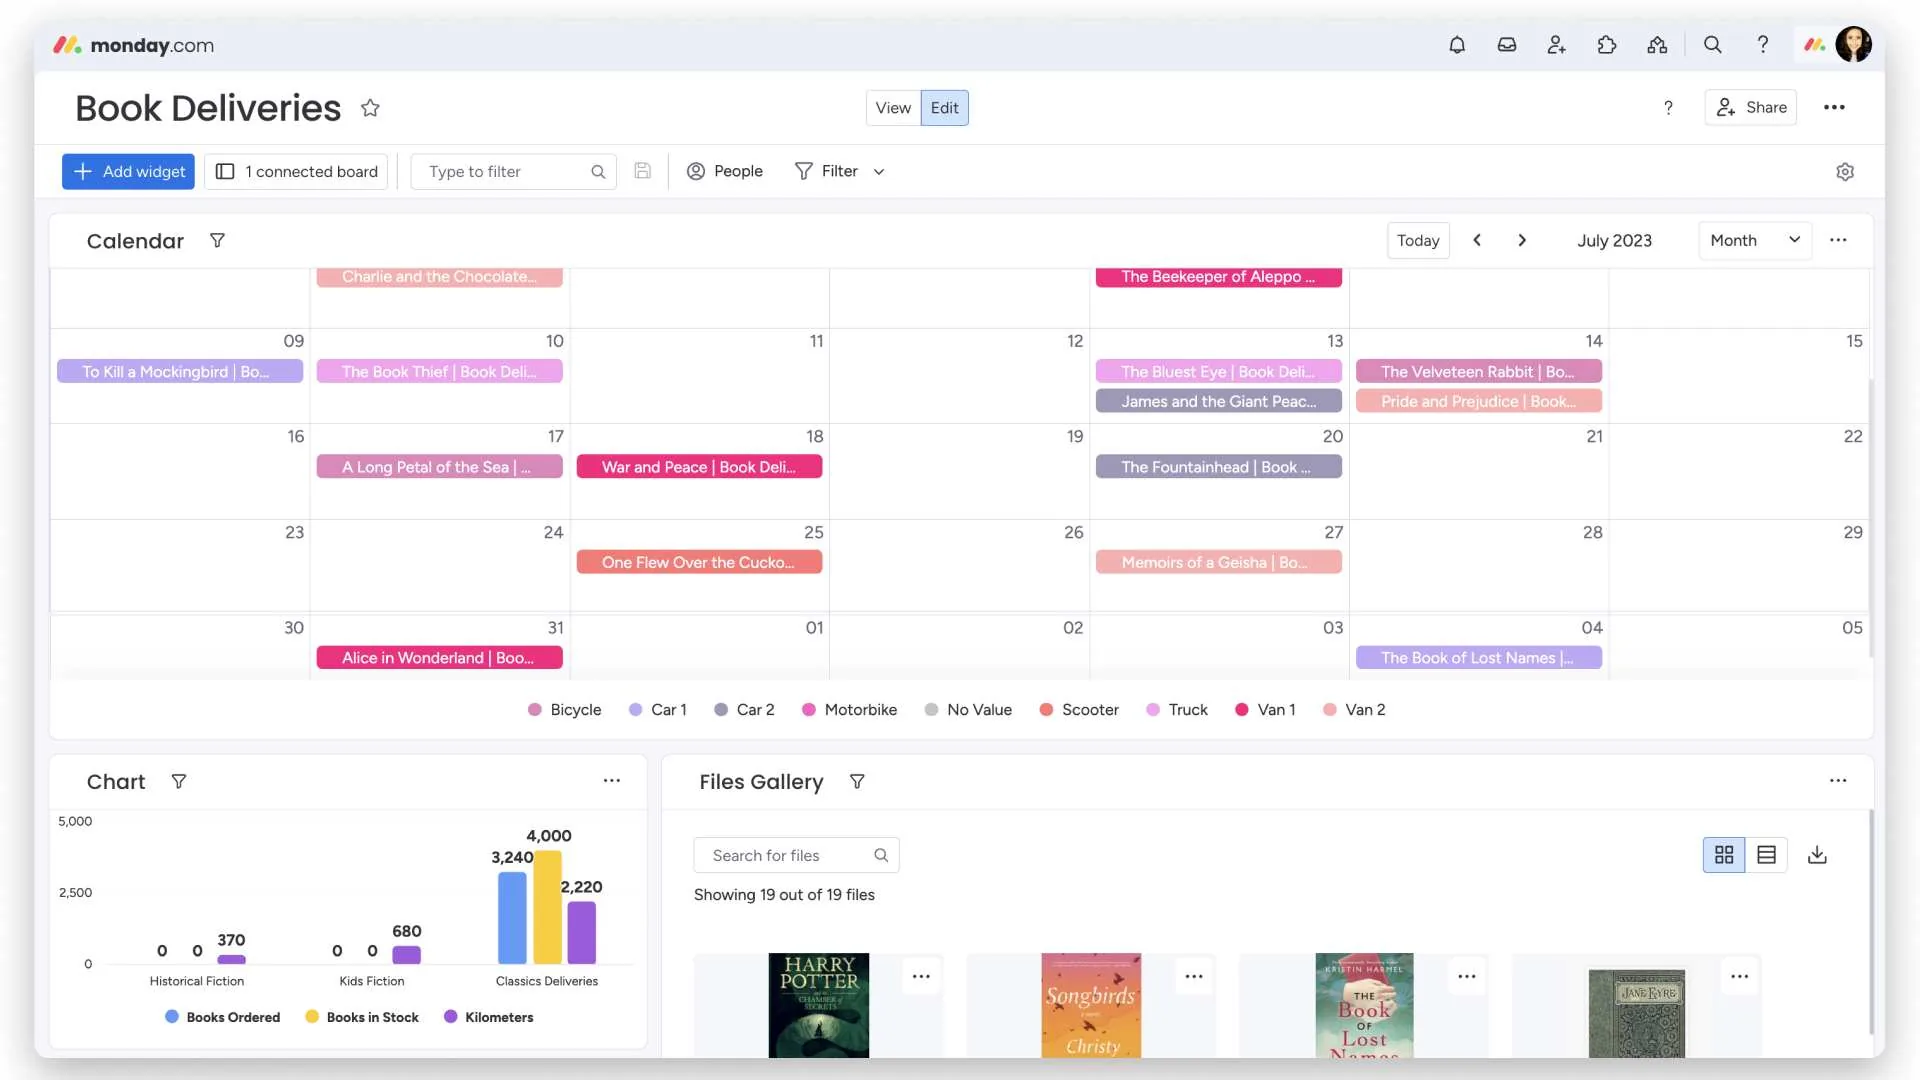
Project management dashboards often feel like adult Tetris. Monday.com turns that stress into something less soul-crushing. It is a work operating system that lets teams plan, track, and manage workflows visually, and its dashboard is modular, colorful, and fully customizable. Timeline views, kanban boards, and task lists are arranged in a way that actually makes sense, even if your team thrives on chaos. Monday.com proves dashboards can be fun without losing professionalism, and that it is satisfying to use is exactly why it belongs here.
Conclusion: Why These Dashboards Deserve Your Attention
There you have it: ten dashboards that prove good design is not about flashy colors or trendy charts. The best dashboard UI designs combine clarity, hierarchy, and usability in ways that make users actually enjoy interacting with data. From Amuse turning entertainment chaos into order, to Search AI making marketing metrics readable, to Upbeat humanizing AI chatbots, they all show what it takes to stand out. Even founders who claim they "don't care about UX" secretly admire dashboards that do not require a PhD to navigate.
Most dashboards fail exactly where these succeed: they overwhelm users, hide important information, or turn simple analytics into a headache. The ones on this list are reminders that functionality can be beautiful, insightful, and even a little fun. So if your SaaS dashboard still looks like a spreadsheet nightmare, it may be time to learn from the best, or let us design one that genuinely works. Because dashboards are not just about looking good, they are about helping users succeed, stay sane, and fall in love with your product.