Short answer: Good startup dashboard design turns data into decisions, not overload. Show the few metrics that drive action first, hide detail until it is needed, and design for the different people who log in. The dashboards users open every day are the ones that make them feel in control—clarity over completeness, always.
Startup Dashboard Design: Turning Data Into Decisions
A dashboard is where your users either feel in control or feel lost. Get it right and it becomes the reason people log in every day. Get it wrong and it becomes a wall of numbers they quietly stop opening. Startup dashboard design is one of those areas where good intentions, "let's show them everything," produce the worst outcomes. Here is how to design a dashboard that informs instead of overwhelms.
Why Do You Need a Dashboard at All?
A dashboard is not just a glitzy UI element, it is a command center. It should give users instant insight, let them track performance, and help them make decisions without digging through miles of menus. When it works, it turns raw data into clarity, which is the whole reason it exists.
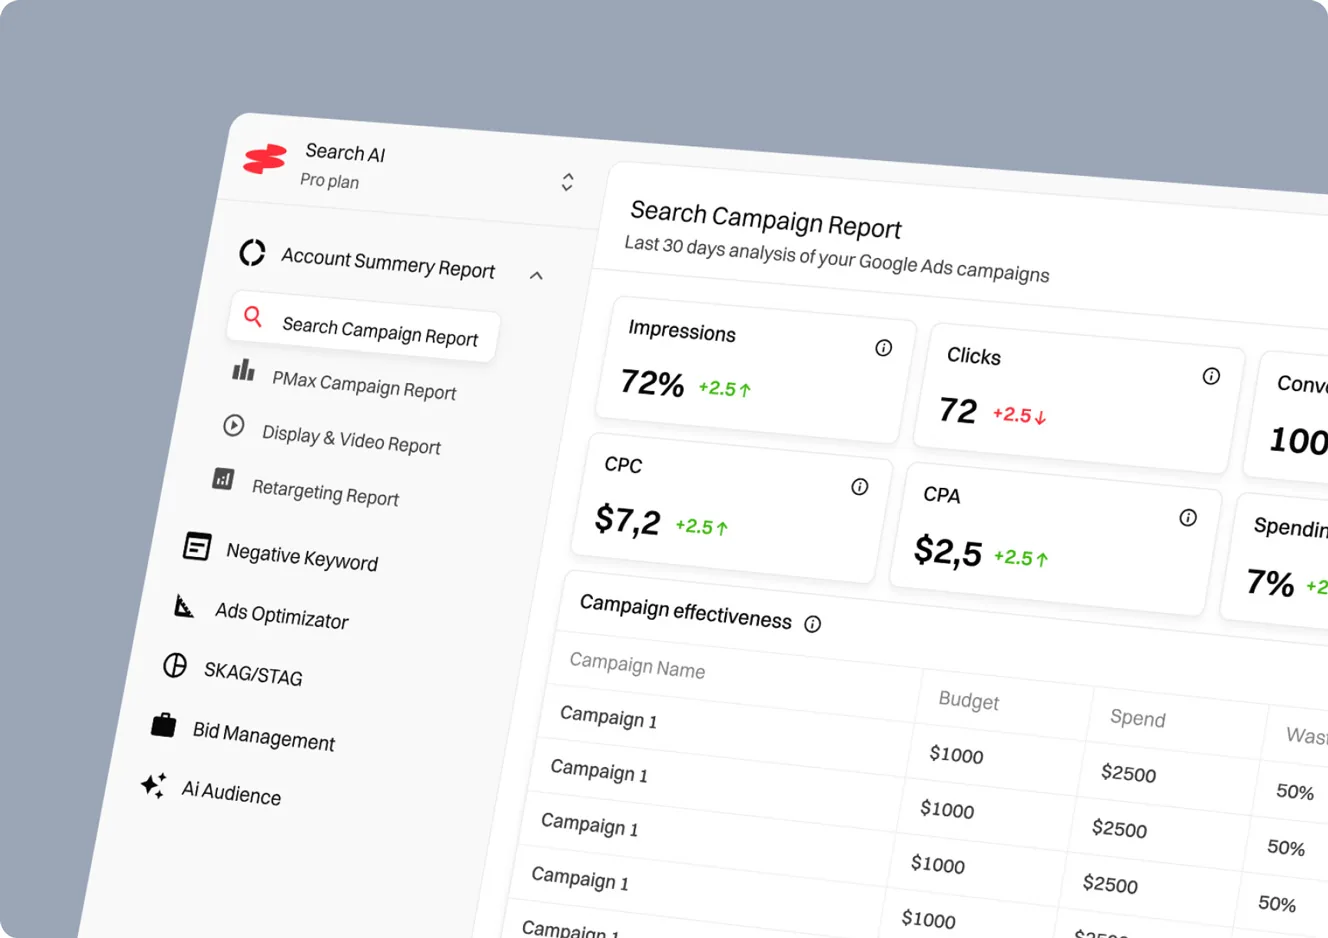
A successful dashboard will show key metrics at a glance, allow customization to each user's needs, provide clear calls to action, and avoid distractions. That last point is where most fail. The temptation is to add more, but a dashboard's value comes from what it leaves out as much as what it includes. Need proof that clean design and AI can coexist? Here is how we approached it for Upbeat, a dashboard that speaks startup and actually makes sense.
The Biggest Dashboard Design Mistakes (and How to Avoid Them)
Information Overload: The Data Dump Effect
The most common mistake is treating the dashboard as a place to display every metric you can calculate. The result is a data dump where nothing stands out because everything is competing for attention. Users open it, feel overwhelmed, and close it. The fix is ruthless prioritization: decide what the user actually needs to see first, give that prominence, and tuck the rest away. A dashboard is a curated view, not a database with a nicer font.
Unreadable Charts: A Picasso Nightmare
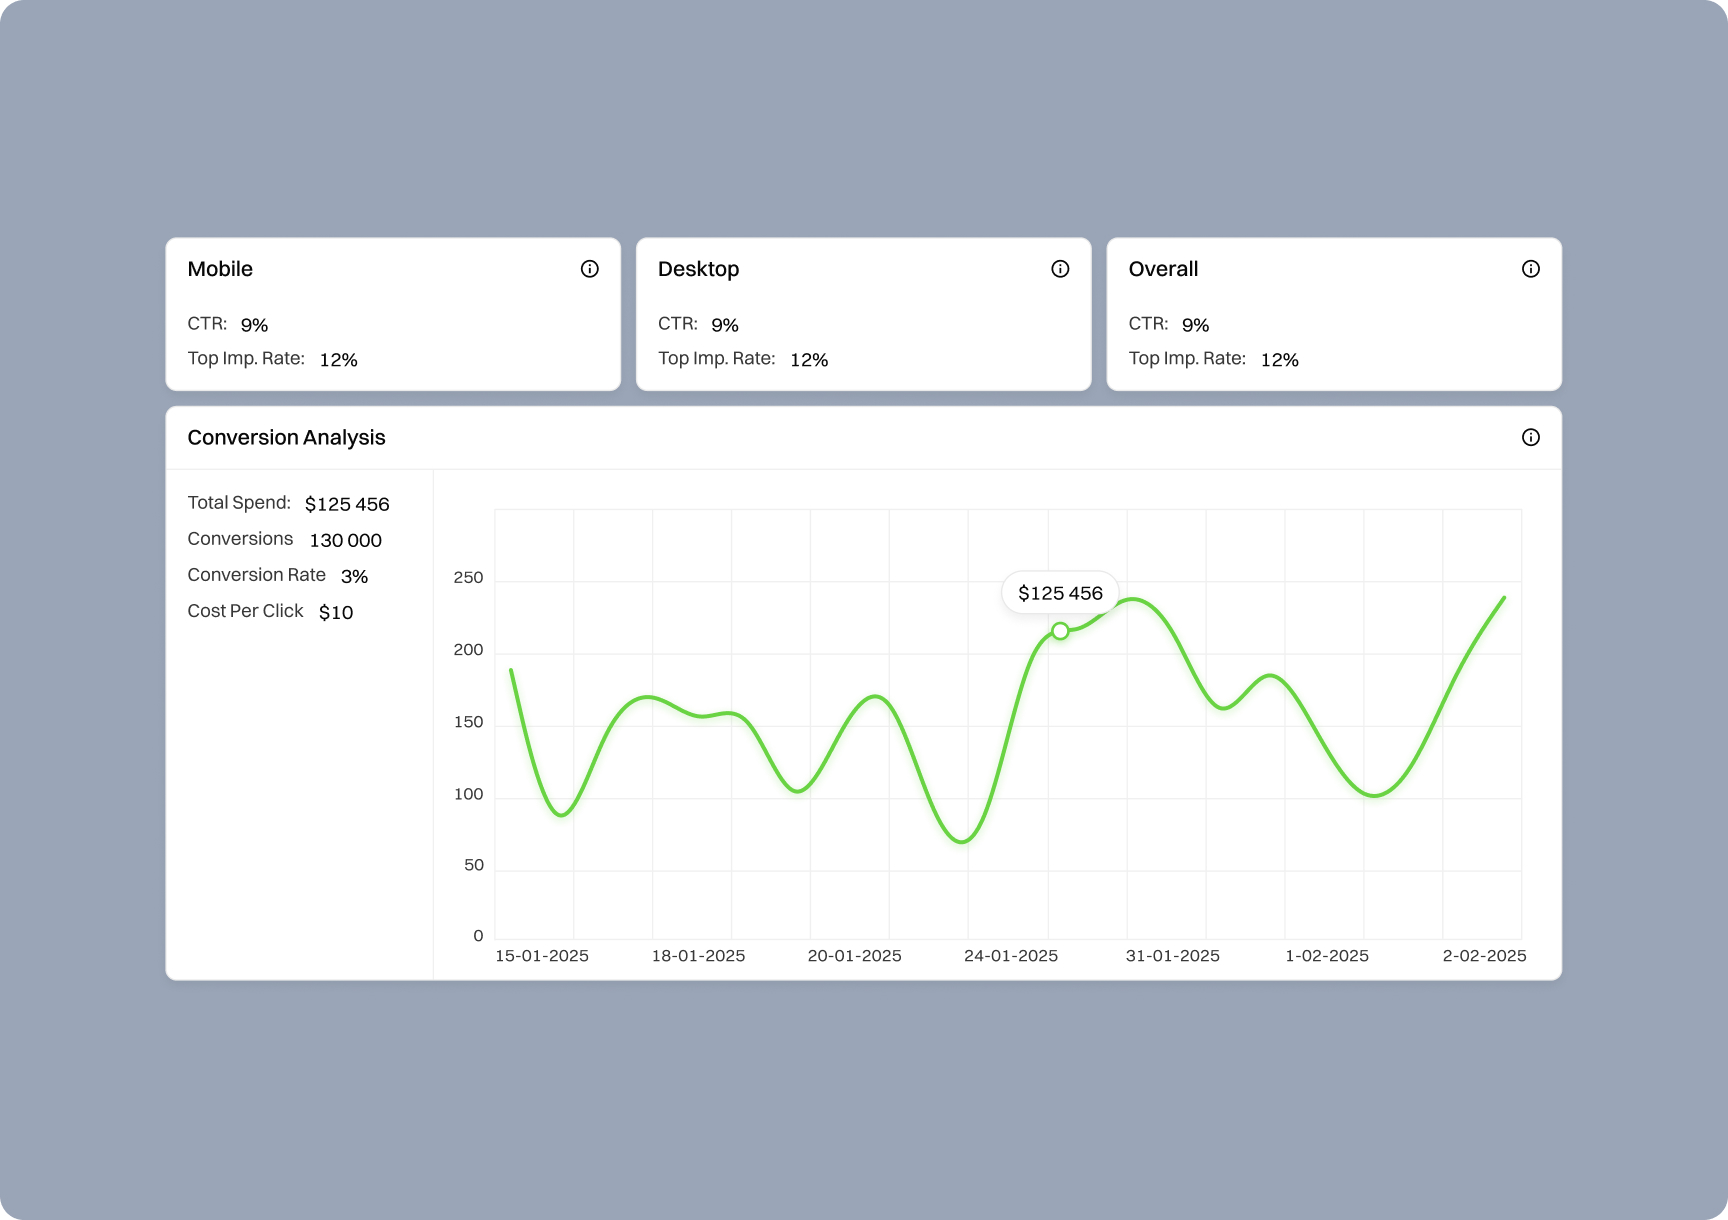
A chart exists to make data faster to understand, not to look impressive. Cramming too many series into one graph, using confusing chart types, or choosing colors that blur together turns a helpful visual into an abstract painting. Every chart should answer a clear question at a glance. If a user has to study it like a puzzle, it has failed at its one job.
No Personalization: One Size Does Not Fit All
Different users care about different things. A founder, an analyst, and an operations lead do not want to stare at the same default screen. A dashboard that cannot adapt forces everyone into a compromise that serves no one perfectly. Letting users customize what they see, or tailoring the view by role, turns a generic dashboard into one that feels built specifically for each person.
What a Successful Startup Dashboard Must Contain
Clear Information Hierarchy
The most important information should be the most visually prominent, full stop. Size, position, and contrast should guide the eye to what matters first, then to supporting detail. A strong hierarchy means a user understands the state of things in seconds, which is the entire promise of a dashboard. Without it, every element shouts equally and the user hears nothing.
Real-Time Data (But Only When Absolutely Necessary)
Real-time updates feel impressive, but they are not always worth the cost or the distraction. Constantly shifting numbers can stress users and strain your infrastructure. Reserve real-time for data that genuinely needs it, like live monitoring or trading, and let everything else update on a sensible interval. Thoughtful timing beats reflexive real-time, both for the user and for your servers.
Intelligent Alerts and Notifications
A great dashboard does not just show data, it tells users when something needs attention. Smart, relevant alerts surface the moments that matter so users do not have to constantly monitor the screen themselves. The key is relevance: too many alerts and people tune them all out, so each notification has to earn its place by being genuinely actionable.
The UI/UX Secrets That Make Dashboards Feel Effortless
White Space Is Your Best Friend
Cramming elements together to fit more on screen backfires. White space gives content room to breathe, separates sections, and makes a complex dashboard feel calm rather than chaotic. It is not wasted space, it is the breathing room that makes everything else readable. The most premium-feeling dashboards are almost always the ones unafraid to leave space empty.
Intuitive Navigation
Users should never wonder where to find something. Logical grouping, consistent placement, and clear labels mean people navigate by instinct rather than effort. The moment a dashboard makes someone hunt, it has added friction to the exact tool meant to remove it. Good navigation is invisible, you only notice it when it is missing.
Dark Mode (Yes, It's That Important)
Dark mode is no longer a novelty, it is an expectation, especially for power users who stare at dashboards for hours. It reduces eye strain, looks modern, and signals attention to detail. Offering a well-implemented dark mode, with proper contrast rather than just inverted colors, is a small touch that users genuinely appreciate every day.
Less Is More
If there is a single principle behind great startup dashboard design, it is restraint. Every element you add competes for attention with every other one, so the discipline is to remove until only the essential remains. A focused dashboard that does a few things clearly beats a crowded one that does everything poorly. When in doubt, take something out.
Designing Dashboards for Different User Types
A subtle but powerful idea in dashboard design is that there is no single user. The founder wants high-level health at a glance. The analyst wants to drill into detail. The operations lead wants alerts and actions. Forcing all of them onto one identical screen guarantees a compromise that frustrates everyone a little.
The stronger approach is role-aware design: default views tailored to what each type of user actually needs, with the freedom to customize from there. This does not mean building three separate products, just thoughtfully prioritizing different information for different roles. A dashboard that greets each user with what matters to them feels personal and useful, while a one-size-fits-all screen feels generic no matter how polished it looks.
Final Thoughts
Great startup dashboard design is not about showing the most data, it is about turning data into decisions with the least friction. Prioritize ruthlessly, build a clear hierarchy, make charts genuinely readable, personalize where it helps, and embrace white space and restraint. Do that, and your dashboard becomes the command center users rely on rather than the cluttered screen they avoid. If you want a dashboard built around clarity and real outcomes, that is exactly the kind of work our SaaS team focuses on.